Crow's Foot ERD – how I always draw data models for data migration
 By Isak La Fleur Engdahl
When I start building an information model at a client, a Crow's Foot entity-relationship diagram (ERD) is almost always the first thing on the whiteboard. It's a compact way to draw what the business actually means by Customer, Order and Product – and, just as importantly, the rules that connect them. If you've never read one before, this is the short, practical introduction I wish more stakeholders had.
The "crow's foot" name comes from the little three-pronged fork at the end of a relationship line. That fork means "many" – and once you can read it, you can read most data models you'll meet.
The three building blocks
A Crow's Foot ERD has only three things in it: entities, attributes and relationships.
Entities are the things the business cares about – the objects, events or concepts you keep data about: a Customer, an Order, a Product. On the diagram they're simply boxes.
Attributes are the data points that belong to an entity – like Customer_FName, Order_Date or Product_Price in the diagram below. They're listed inside the box, with the unique identifier (the primary key, PK) at the top – Customer_ID, Order_ID, Product_ID. The key is what lets you tell one row apart from every other.
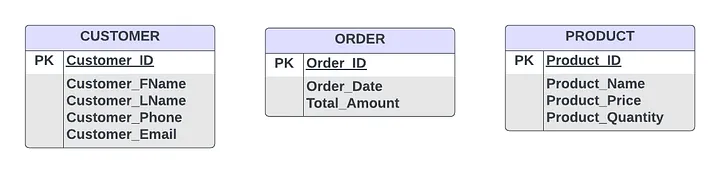
Relationships are the lines between the boxes. A line says "these two entities are connected" – a Customer places an Order. But the line alone doesn't tell you how many. That's what the symbols at each end are for.
Reading the symbols: cardinality and modality
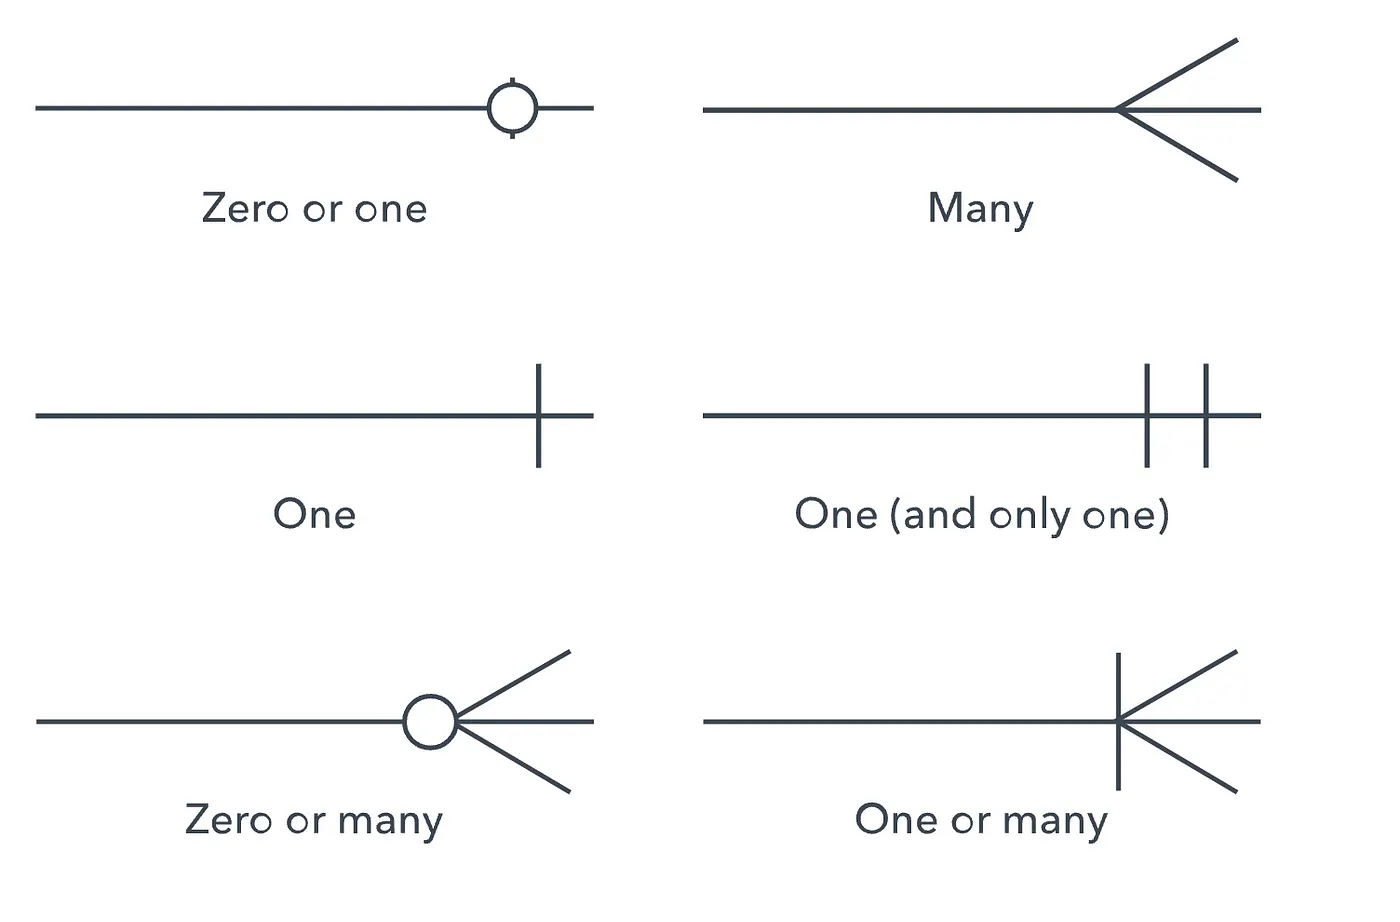
Every relationship line carries a pair of symbols at each end. They look fiddly at first, but there's a simple rule:
- The symbol nearest the box (the inner one) tells you the maximum – one or many.
- The symbol furthest from the box (the outer one) tells you the minimum – zero (optional) or one (mandatory).
There are only three base marks:
| Mark | Meaning |
| ---------------------- | ----------------------------------- | --- |
| Perpendicular line | | One |
| Crow's foot (the fork) | Many |
| Circle o | Zero – the relationship is optional |
You read each end from the inside out: maximum first (nearest the box), then minimum. Combine the marks and you get the six cases in the diagram below:
- One – a single line.
- One (and only one) – a double line: mandatory and exactly one.
- Zero or one – line on the inside, circle on the outside.
- Many – a crow's foot on its own.
- Zero or many – crow's foot inside, circle outside.
- One or many – crow's foot inside, line outside.
The four relationships you'll actually use
Combine the symbols and you get the handful of patterns that describe almost any model:
- One-to-one – each instance in A relates to exactly one in B. Genuine one-to-ones are rarer than people think; often it's a sign two entities should be merged, or that you're modelling an optional extension of a record.
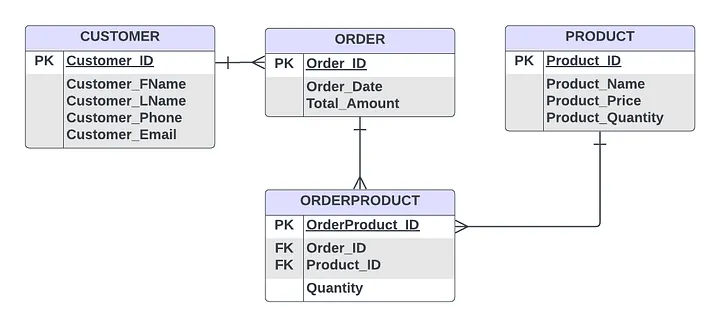
- One-to-many – one A relates to many B, but each B belongs to a single A. One Customer places many Orders; each Order belongs to one Customer. This is the workhorse of relational design.
- Many-to-many – many A relate to many B. Relational databases can't store this directly, so it's broken into two one-to-many relationships through a junction (associative) table. Orders and Products is the classic example – resolved by the
ORDERPRODUCTjunction table in the middle in the diagram below. - Zero-to-many – an A relates to zero or many B. The little circle is the bit people skip, and it matters: it's the difference between "every customer must have an order" and "a customer may exist with no orders yet."
Why I use this when modelling data at companies
A Crow's Foot ERD isn't just a database artefact – it's a conversation tool. In migration and MDM work the hard part is rarely the SQL; it's getting the business to agree on what the data means. A diagram on the wall does that faster than a spec ever will:
- It surfaces the rules early. "Can an order exist without a customer?" is a one-symbol question on the diagram, but it can be a very expensive surprise during a load if nobody asked it. Those minimum-cardinality marks – the circle versus the line – are exactly the kind of referential rule that breaks migrations when they're discovered too late.
- It exposes hidden many-to-manys. Half the modelling work is spotting the junction tables the business didn't know it needed.
- It gives source and target a shared map. When you're moving data into an ERP like SAP or Dynamics 365, comparing the source model and the target model side by side – both in the same notation – makes the gaps obvious.
- Everyone can read it. Unlike UML or a raw schema, a business analyst, a developer and a domain expert can all stand at the same whiteboard and agree.
Getting started
You don't need special software to begin – a whiteboard and the six symbols above will take you a long way. When you want something shareable, tools like Lucidchart and draw.io both support Crow's Foot notation and can generate schema from the diagram.
The skill that matters isn't the drawing; it's asking the right questions about minimums and maximums until the model reflects how the business really works. That conversation is where good information models – and successful migrations – start.
Want a second pair of eyes on your information model? Get in touch – it's exactly the kind of work I do.